| StockFetcher Forums · General Discussion · EMA(13)/EMA(48.5) crossover | << >>Post Follow-up |
| txpipeliner 3 posts msg #146601 - Ignore txpipeliner |
2/16/2019 2:58:20 PM How would I create a new indicator that calculates the difference between EMA(13) and EMA(48.5)? With the value being negative when the EMA(13) crosses below the EMA (48.5). Here is the article I read detailing this crossover, https://finance.yahoo.com/news/study-determines-best-moving-average-195042216.html. |
| four 5,087 posts msg #146603 - Ignore four modified |
2/16/2019 3:23:34 PM Per their site*: * Indexes were used, not individual stocks. * Range of data from 10/1989 - 4/2010 * http://etfhq.com/blog/2010/05/25/best-technical-indicators/ ------------------------------------------------------------------------------------- Click on the chart below (recent 2 years displayed) for the filter and for QQQ 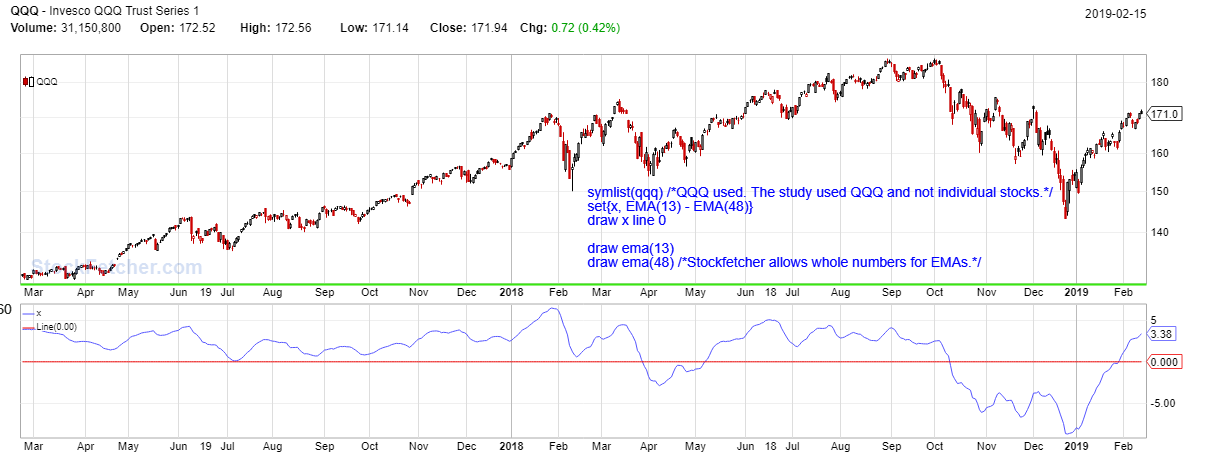 |
| txpipeliner 3 posts msg #146605 - Ignore txpipeliner |
2/16/2019 4:33:38 PM Thank you!!! I just glanced over the charts in the article and did not look at the text in them. |
| Mactheriverrat 3,178 posts msg #146606 - Ignore Mactheriverrat |
2/16/2019 5:40:20 PM Good Yahoo article EMA(13)/EMA(48.5) crossover. My problem is I try too hard nailing the trend too early and get stopped out before the trend really changes. MTW is a good example of trend change and EMA(13)/EMA(48) crossover. I've add a few longer term average showing the squeezing and the starting of roll over of trend change.  |
| gmg733 788 posts msg #146618 - Ignore gmg733 |
2/18/2019 11:59:13 AM @Mac Do you wait for the Guppy to tell you long/short, then look for an entry? Thnx |
| Mactheriverrat 3,178 posts msg #146623 - Ignore Mactheriverrat |
2/19/2019 9:14:17 AM When you see the longer term averages start squeezing and rolling over.  |
| StockFetcher Forums · General Discussion · EMA(13)/EMA(48.5) crossover | << >>Post Follow-up |